Plate 02 Guide
The Mandelbrot set explained: one rule, endless detail
The Mandelbrot set comes from a rule you can write on one line. Here is how it works, how the picture is drawn and how to read it. The home page has a live zoom if you want to see it move.
The rule in one line
Pick a complex number c. A complex number is a point on a plane: its real part goes left and right, its imaginary part goes up and down. Start with z equal to 0 and repeat one step: replace z with z squared plus c. The Mandelbrot set is the collection of all values of c for which z never runs away to infinity.
In layman's terms: each point on the plane is a question, and the picture records the answer. Does the number stay in a bounded area forever, or does it escape?
Testing a single point
Four examples are easy to check by hand:
- c = 0: z stays at 0 forever. The point is in the set.
- c = 1: z goes 0, 1, 2, 5, 26 and keeps growing. The point escapes.
- c = -1: z goes 0, -1, 0, -1 and repeats. The point is in the set.
- c = i: z goes 0, i, -1 + i, -i, -1 + i, -i and repeats. The point is in the set.
A useful shortcut: once the distance of z from 0 is greater than 2, the sequence is certain to escape. A program therefore stops testing a point as soon as that happens and records how many steps it took.
Reading the picture
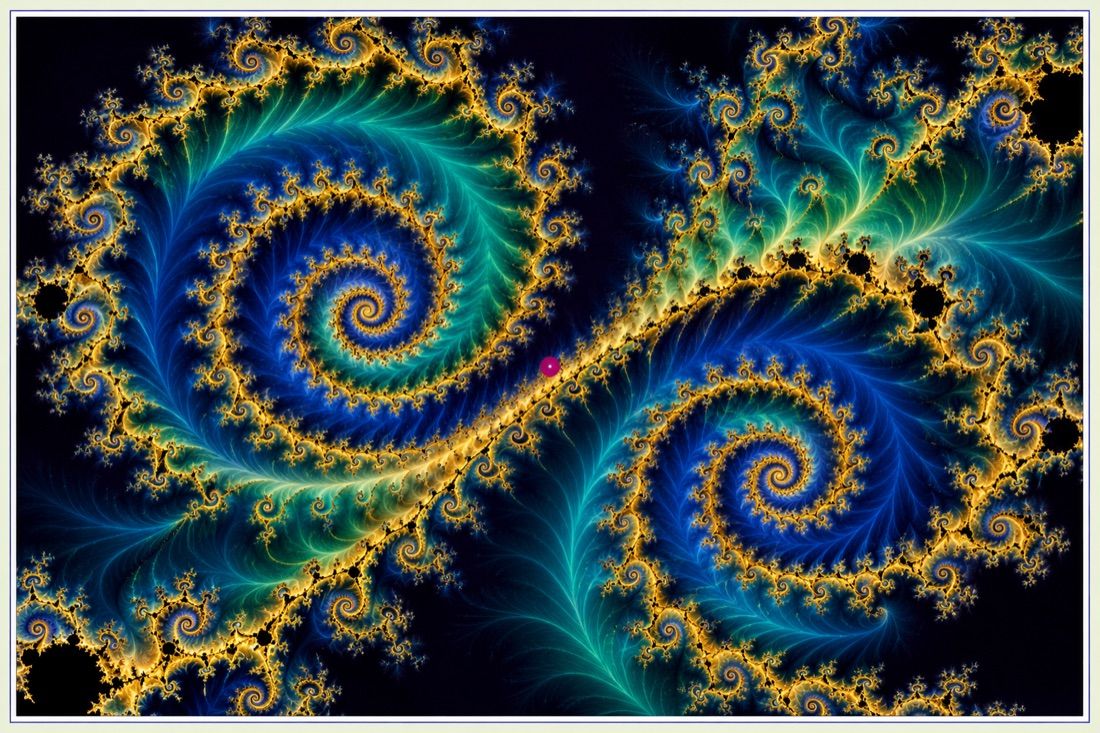
Points inside the set are usually painted black. Points outside are coloured by how fast they escaped. The set lies entirely between about -2 and 0.25 on the real axis. The big heart shape in the middle is the main cardioid, and the round bulb to its left is centred at -1. Smaller bulbs sit around the cardioid, and along the edge you can find tiny copies of the whole set.
The set is connected, which means its pieces are joined by thin filaments, a fact proved by Adrien Douady and John Hubbard, who also gave the set its name.
Colour is a choice
The set itself is only a yes or no for each point. Everything colourful in a picture is an artistic layer added from the escape data. A plain count of steps creates visible bands. A smooth, fractional count, often called smooth or normalised colouring, hides the bands and gives clean gradients. Different palettes can make the same region look calm, fiery or metallic. The making guide returns to this point.
Zooming in
The edge of the set has detail at every scale. A zoom near -0.75 + 0.1i, in the area often called seahorse valley, shows spirals and curls that look like the tails of seahorses. The first computer pictures of the set were made around 1978 by Robert Brooks and Peter Matelski, and Benoit Mandelbrot produced high quality images at IBM in 1980.
Why deep zooms need more precision
Computers store most numbers with about 15 or 16 significant decimal digits. When a zoom gets to roughly a million million times magnification, neighbouring pixels differ by less than that precision and the picture turns into blocks. Programs that go deeper use higher precision arithmetic or clever shortcuts based on one carefully computed reference point. The live zoom on the home page uses ordinary graphics card arithmetic and stops at a modest depth for that reason.
What the set is used for
It is mainly a subject of study and of art. It is also a popular test program for the speed of computers and graphics cards and for numerical precision, because one picture needs millions of identical calculations. It is not a model of any physical object.
3D versions and what they are
There is no true three dimensional Mandelbrot set, because complex numbers live on a plane. The Mandelbulb, introduced by Daniel White and Paul Nylander in 2009, is a related three dimensional formula that produces similar looking shapes. See fractal art software for programs that render it. The set is also not related to the Fibonacci sequence: one is built by squaring complex numbers, the other by adding the two previous terms.